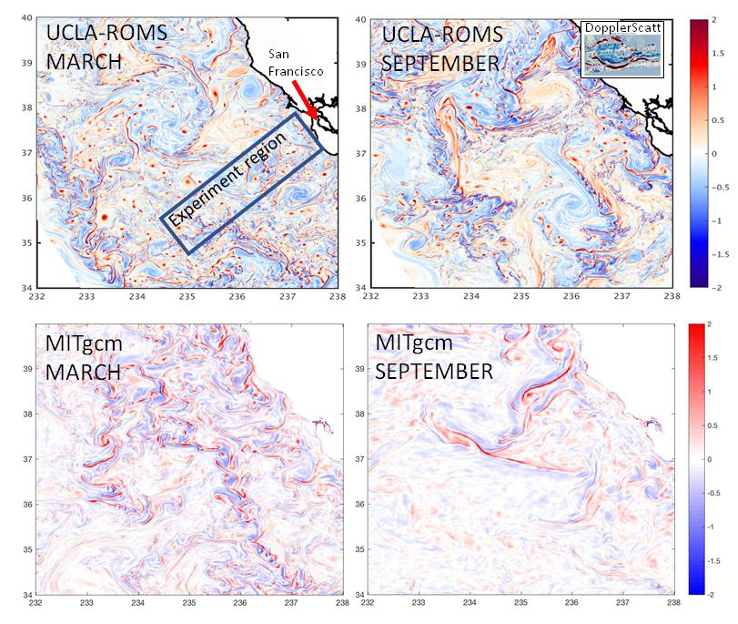
Figure 1.2 - Surface vorticity off Central California in two submesoscale-resolving models in March (left column) and September (right column). ROMS (top row 500 m resolution) and JPL-MITgcm (bottom row, ~ 2km resolution) show different structures and different seasonal evolution. The rectangle in the upper left shows our experiment domain. In all panels, the vorticity has been normalized by the local value of the Coriolis parameter. The inset in the upper-right panel is the normalized vorticity measured by DopplerScatt in the Gulf of Mexico (Fig. 1.4), shown with the same distance scaling and color scale as in the model fields-- we now have an exciting new capability for mapping ocean vorticity and divergence.
Subject
Mission