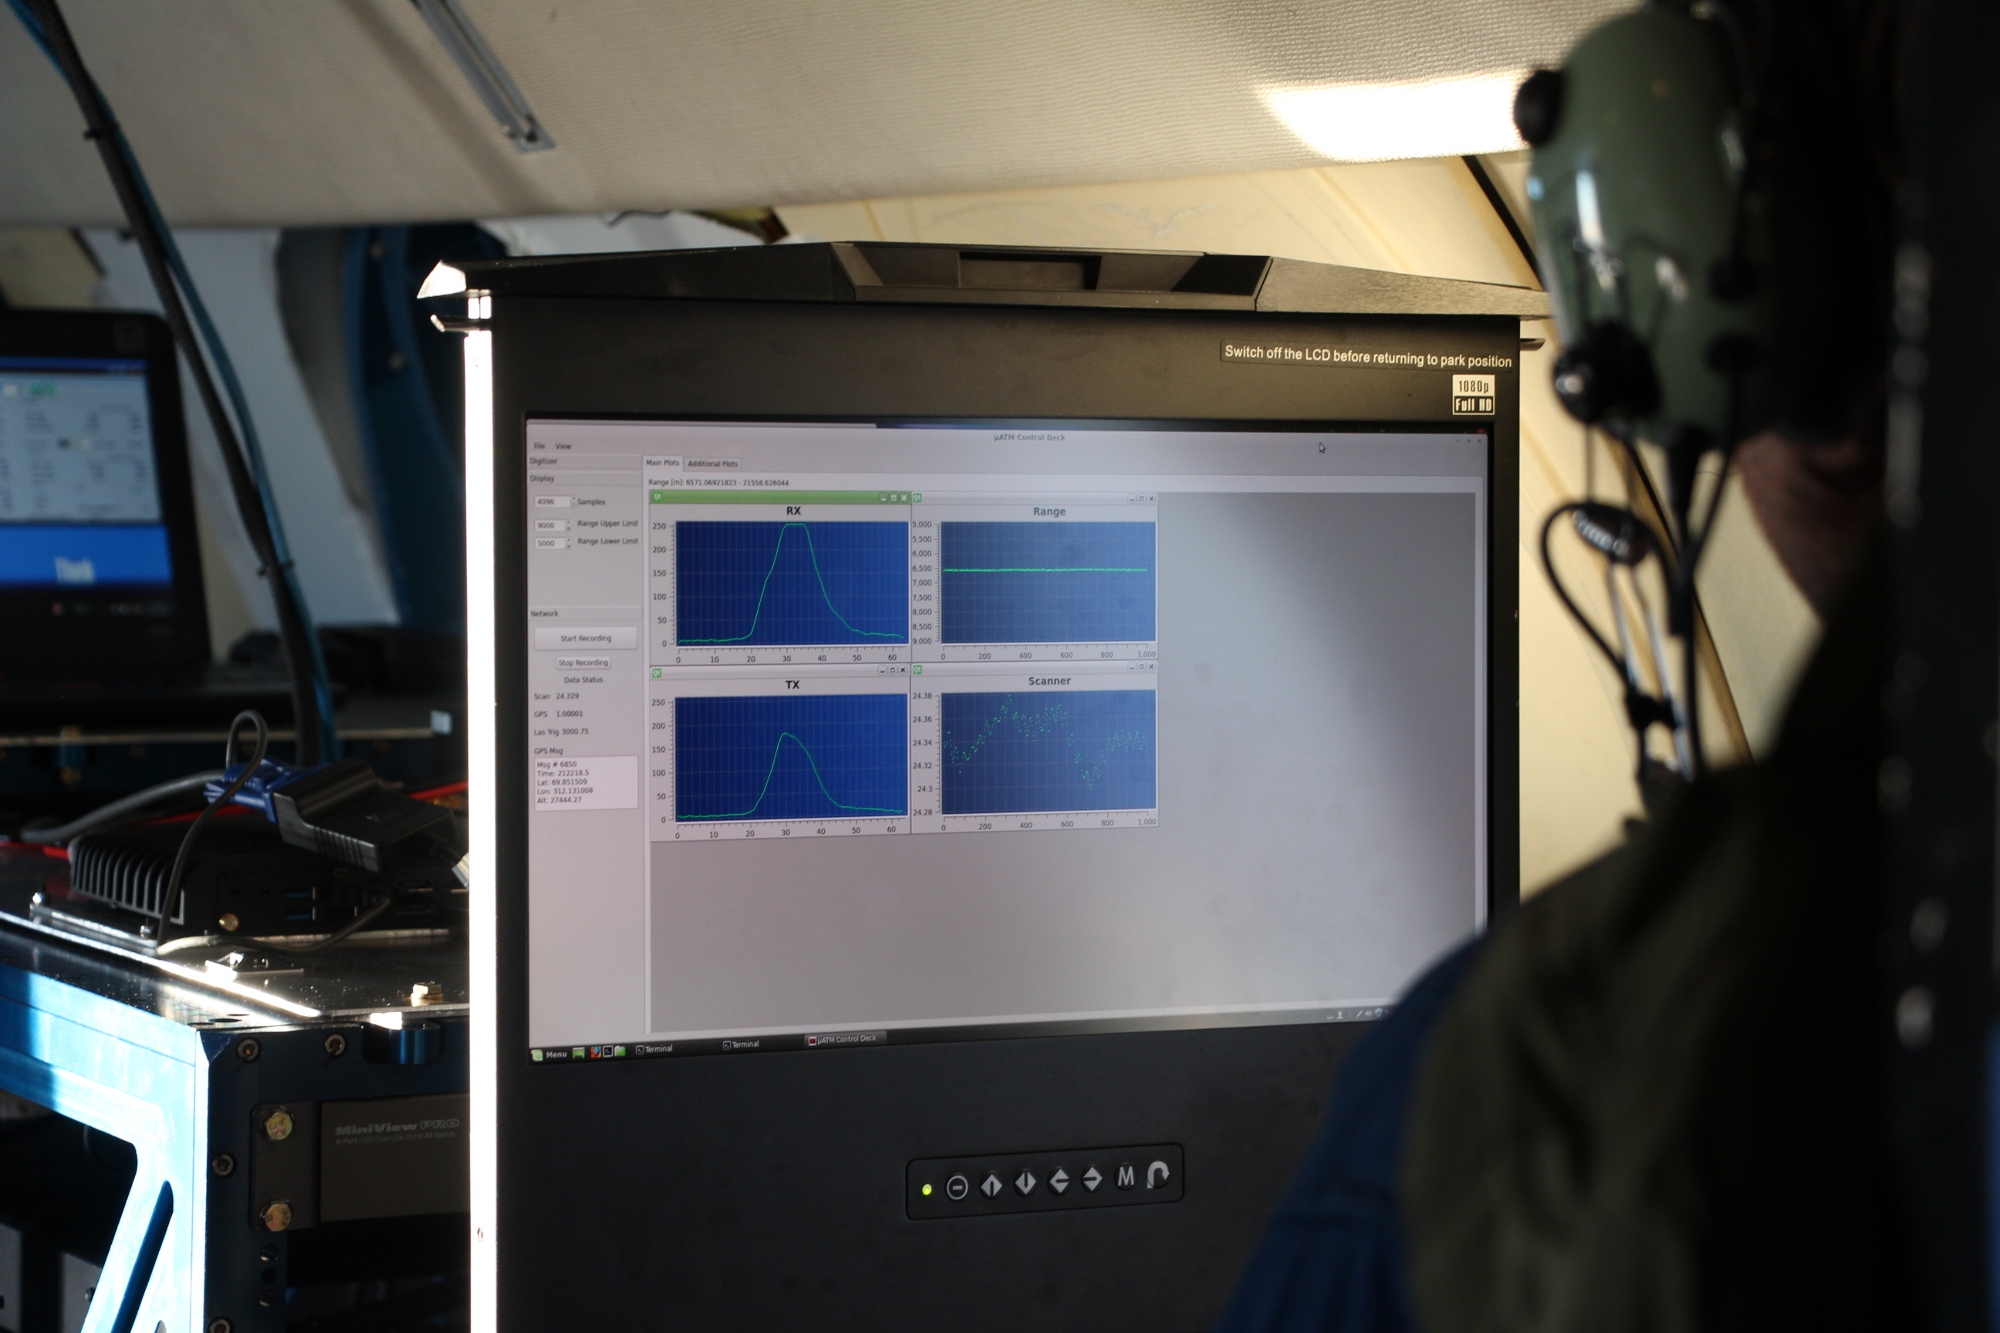
The ATM real-time display being monitored by Alexey Chibisov, at right. The green trace on the blue field at the display's bottom left is the shape of the ATM's transmit waveform, and the one above it is the return waveform. Range from the sensor to the surface is usually measured by the time elapsed between the centroids of these two waveforms (multiplied by c, the speed of light), but other ranging techniques can be applied during post-flight processing as well.
Credits
NASA/John Sonntag
Subject
Mission