The primary goal of the Stratospheric Tracers of Atmospheric Transport (STRAT) campaign is the measurement of the morphology of long-lived tracers and dynamical quantities as functions of altitude, latitude, and season in order to help determine rates for global-scale transport and future distributions of high-speed civil transport (HSCT) exhaust emitted into the lower stratosphere. The observations will also improve understanding of broader issues involving transport of gases and aerosols in the stratosphere. STRAT is being sponsored by NASA's Atmospheric Effects of Aviation Project (AEAP), Upper Atmosphere Research Program (UARP), and Atmospheric Chemistry Modeling and Analysis Program (ACMAP).
Results from recent airborne campaigns (the Airborne Antarctic Ozone Expedition (AAOE); the first and second Airborne Arctic Stratospheric Expeditions (AASE I and II); the Stratospheric Photochemistry, Aerosols, and Dynamics Expedition (SPADE); and the Airborne Southern Hemisphere Ozone Experiment/Measurements for Assessing the Effects of Stratospheric Aircraft (ASHOE/MAESA)) demonstrate the capability for studies of appropriate combinations of tracers to define atmospheric transport rates for time scales from days to years, and to provide critical tests for atmospheric models used to predict impacts of future fleet emissions.
A secondary goal of STRAT is the further characterization of atmospheric photochemistry. As shown in earlier airborne campaigns, measurement of free radicals within the context of a sufficiently large suite of tracer observations provides stringent tests of our understanding of the processes that control ozone photochemistry. The STRAT campaign will extend the regions and seasons for which we have such measurements.
Objectives
To define the rate of transport of trace gases (such as HSCT exhaust emissions) from the stratosphere to the troposphere, i.e., to determine the global burden that will result from continuous aircraft emissions into the stratosphere. This objective requires detailed measurements of tracer concentrations close to the tropopause, where tracer gradients are very steep.
The region near the tropopause appears to play a key role limiting the rate of stratosphere-to-troposphere exchange. Studies of this region are a primary focus of the mission.
To improve understanding of dynamical coupling and rates for transport of trace gases between tropical regions (where ozone formation is most rapid) and higher latitudes and lower altitudes (where most ozone resides). For example, we seek to define the quantity of exhaust entrained from mid-latitude source regions into the tropical upwelling zone, where it can be transported to critical altitudes (above 25 mbar) in the tropics.
This objective requires simultaneous high-altitude measurements of tracer concentrations in the tropics for comparison with similar tracer values observed at lower altitudes and higher latitudes.
To improve understanding of the chemistry in the upper troposphere and lower stratosphere. This will include the first concerted measurements of the coupled chemistry of odd hydrogen, odd nitrogen, and CO in the near-tropopause region. Understanding the partitioning of NOy in this region is poorly constrained and the lack of OH and HO2 measurements has hindered progress. These observations will address some of the key issues related to the influence of both a potential HSCT fleet as well as the existing subsonic fleet on ozone.
This objective requires simultaneous measurement of free radicals and tracers both in the troposphere and lower stratosphere.
To provide data sets for testing two-dimensional (2-D) and three-dimensional (3-D) models used in assessments of impacts from stratospheric aviation, including meteorological data for application to data-assimilation models and globally-representative ensembles of tracer data.
This objective requires acquisition of data from the widest possible range of altitudes and latitudes, with resolution of seasonal and interannual variability. It is the focus of both the observational and theoretical parts of the mission.
The experimental design for achieving these objectives is to measure a complement of tracers with contrasting sources, sinks, and lifetimes (e.g., CO2, N2O, O3, H2O, CFCs, CH4, NOy, and CO) and to provide simultaneous observations of free radicals. We will also determine dynamical parameters (temperatures, winds) in the upper troposphere and lower stratosphere. The measurements will be made several times per year, for one to two cycles of the Quasi-Biennial Oscillation (QBO), throughout the Northern Hemisphere.
Outline of the Mission
1. ER-2 Measurements
The NASA ER-2 high-altitude aircraft will cover the Northern Hemisphere from approximately 60 N to 0 N, 15-20 km, emphasizing extensive sampling from just above and just below the tropopause to 20 km.
- We will obtain a representative ensemble for the Northern Hemisphere in order to maintain an unbroken time series of observations with seasonal resolution at key times in the annual cycle, from SPADE test flights (November 1992) to the end of the mission.
- Observations focus on obtaining maximum short- and long-term precision to make best use of the time series of data.
- Intercomparison among sensors on different platforms is an important mission goal, and will promote the highest possible accuracy and uniformity of the measurements.
- The test flight series will help obtain optimum precision and streamline operations. Intercomparisons, incorporating simplified blind protocols, will take advantage of scheduled missions to maximize efficiency.
Schedule
A single flight from NASA Ames Research Center was conducted directly after ASHOE/ MAESA in November 1994 to preserve continuity from SPADE, through ASHOE/MAESA, and into the STRAT period.
The first test flights were conducted from NASA Ames in May 1995. Flight protocols were tested and payload certification was obtained.
STRAT deployments are planned for October 16 - November 12, 1995; and February, July, and October 1996. May, July, and September 1997 STRAT science objectives will be addressed as part of the Photochemistry of Ozone Loss in the Arctic Region in Summer (POLARIS) campaign. The scientific objective of the POLARIS aircraft campaign is to evaluate the magnitude of the loss rate of stratospheric ozone over a range of altitudes and latitudes in the summer season of the Northern Hemisphere. Some STRAT ER-2 flights are also possible in 1998.
Typical Deployment Scenarios:
- Northern survey flight with at least one vertical profile at high latitudes
- Flights to and from Hawaii (and other possible sites)
- Tropical survey flight (from Hawaii) with at least one vertical profile at low latitudes
- Stair-stepping flights from the lowest possible altitude to approximately 70 kft
2. High-Altitude Observations
The Observations from the Middle Stratosphere (OMS) activity provides high-altitude measurements as a partner with STRAT and other missions. High-altitude measurements will be used in conjunction with the ER-2 observations in the Northern Hemisphere, covering a range of latitudes from the tropics to 65 N. These measurements are essential for defining the transport and transport rates of trace gases, particularly in the tropics and between the tropics and middle latitudes. These transport rates define the spread of HSCT exhaust to the Southern Hemisphere or to higher altitudes (e.g., the ozone source region), the spread of volcanic debris in the stratosphere, and the atmospheric lifetimes of various anthropogenic pollutants.
OMS provides measurements of long-lived tracers at high spatial resolution over more of the transport circulation than is possible with the ER-2. The measurements will extend from the troposphere, through ER-2 altitudes, up to 32 km altitude. The variations of tracers and their correlations in this region have been measured remotely from satellites and the Space Shuttle, but essentially no in situmeasurements exist.
Ideally, trace gases would be measured from 32 km to the troposphere over a large range of latitudes. A good strategy would mimic that used for the ER-2 during the 1994 Airborne Southern Hemisphere Ozone Experiment/Measurements for Assessing the Effects of Stratospheric Aircraft (ASHOE/MAESA) campaign: horizontal flight across dynamical gradients combined with vertical profiles at critical locations. However, a high-altitude platform with good horizontal range does not yet exist. Thus, the initial high-altitude measurements for STRAT and OMS will be vertical profiles at a few locations from helium-filled scientific balloons.
The primary in situ measurements of several tracers will be made in both the middle latitudes and the tropics by balloon-borne instruments. The species to be observed are N2O (tropospheric source/stratospheric sink), CO2 (tropospheric source with seasonal variation), O3 (stratospheric source), CFC-11 (tropospheric source/relatively fast stratospheric sink), CH4 (tropospheric source/stratospheric sink), H2O (tropospheric source with seasonal variation), and SF6 (tropospheric source and trend but no known sink). The goal is to observe the vertical propagation of the seasonal cycles of CO2 and H2O and the variation of the other long-lived tracers and to compare the tropical observations with those from middle latitudes for signs of mixing.
Additional measurements will be made by remote sounding from instruments flown higher in the stratosphere. Such measurements lack high spatial resolution and the precision for species such as CO2, which has a significant variation of 1 part per 360. However, they include a much larger number of chemical species, including N2O, NOy (by components), several components of organic and inorganic chlorine, CH4, H2O, SF6, C2H6, C2H2, CO, and O3. These measurements are most useful in the middle latitudes and high latitudes, where correlations of species depict the rapid quasi-isentropic diffusion in middle latitudes [Plumb and Ko, 1992].
These balloon-borne observations will complement and be compared to ER-2 observations below 20 km and to satellite observations above. Thus, observations from the middle stratosphere by both in situ and remote techniques will serve to tie together the satellite and ER-2 data sets.
Using helium balloons, only a few flights at a few latitudes will be possible within the first three years. The focus will be on in situ observations from middle latitudes and the tropics, but remote measurements by high-resolution infrared absorption observations will complement these observations at higher latitudes. These critical balloon flights will be conducted in late summer, 1996.
Additional balloon flights will be developed as part of other missions, such as the 1997 POLARIS mission. This experiment is designed to study ozone photochemistry in the summertime lower stratosphere at middle and high latitudes. OMS will extend a limited set of measurements of transport and chemistry to 32 km.
We plan to measure CO2, N2O, and other tracers with diverse sources and sinks at high altitudes at the equator in the same period as these tracers are being observed at mid- or high latitudes by the ER-2. The role of advective vs. dispersive processes will be revealed in deviations of tracer-tracer correlations in the inner tropics from the compact relationships observed simultaneously by the ER-2. For example, some models predict that the seasonal variation of CO2 should propagate upward in the inner tropics before being globally transmitted by dispersive processes [Plumb, 1994], providing a set of CO2-N2O correlations which contrast distinctly with mid-latitude correlations.
Potential Collaborations:
- A variety of measurements will be made by the Priroda platform aboard the Russian Mir space station. Trace gas measurements provided by the atmospheric instruments on the Priroda module (DOPI, ISTOK-1, and OZON-Mir) have the potential to enhance significantly the STRAT mission's ability to meet its scientific goals. Because of this potential, the STRAT science team will collaborate with the Priroda science team to perform a series of coincident observations with the Priroda platform. Specifically, it is proposed that the Priroda atmospheric instruments focus on performing coincident measurements during the STRAT deployment phases over approximately the same time period and with the same latitude coverage. The most important phase for these coincident measurements will be October 1996, when the ER-2 will be flying on conjunction with the high-altitude balloon payload. The prioritized list of observations includes N2O, CH4, H2O, F-12, F-11, O3, and SF6 over the altitudes from the tropopause (12 km) to 32 km. Latitudinal coverage should focus on the 8 S to 65 N region.
- Take measurements using other platforms, e.g., WB-57F or remotely piloted aircraft(RPAs).
- Coordinate with the DC-8 during Tropical Ozone Transport Experiment/Vortex Ozone Transport Experiment (TOTE/VOTE) or other lower-altitude platforms with lidar (O3, CH4, H2O, T, etc.) for global-scale surveys. In situ capabilities on these aircraft could help further constrain the radical photochemistry, especially if coordinated with ER-2 tropospheric measurements.
Summary of Scientific Framework
The problem of predicting the distribution of long-lived trace gas emissions in the stratosphere and its effects on global ozone distributions may be divided conceptually into two parts:
- (1)
- Defining the rate of transport of these trace gases (such as HSCT exhaust emissions) from the stratosphere to the troposphere, i.e., the global burden that will result from continuous emissions into the stratosphere.
- (1a)
- For example, what will be the global burden of the HSCT exhaust after many years of operation? How will the global burden be influenced by interannual variability, specifically such phenomena as the QBO?
- (1b)
- What will be the vertical and meridional distribution of HSCT exhaust products, with particular attention to the fraction of the exhaust that is transported to high altitudes in the tropics where it may perturb the primary source region for global ozone? It is clear that this may depend on the QBO and related phenomena, and therefore may change significantly on interannual time scales [Trepte et al., 1993; Trepte and Hitchman, 1992].
- (2a)
- Constraining the net chemical changes affecting ozone due to the emissions of a potential HSCT fleet, as well as the present and future subsonic fleet. In situ observations of free radicals should provide answers if the relevant altitudes can be sampled sufficiently.
- (2b)
- Defining the perturbations to global ozone concentrations resulting from (2a), including feedback between ozone and transport. Models will be required to predict effects of HSCTs since they are not yet flying.
STRAT focuses on (1), addressing one of the problems confronting stratospheric assessments: the uncertainty of transport effects on trace gas distributions [National Research Council, 1994].
It appears that a "bottleneck" just above the tropopause may be an important factor regulating the stratospheric mean residence time for trace gases (1a), inhibiting downward transport to altitudes where air may be entrained from the stratosphere into the troposphere (see below). A better understanding of the factors limiting downward transport represents the focus of the measurements.
The transport of trace gases to high altitudes in the tropics (1b) may be limited by the rate of entrainment of mid-latitude stratospheric air into the core of the stratospheric tropical upwelling zone (see below). This is the issue to be investigated in the high-altitude observations portion of STRAT.
Radical observations (2) will also contribute valuable data. The measurements of radicals contribute to our understanding of the photochemical processes that influence the lifetimes of the tracers. The data should provide further information about the process that partition the nitrogen species both in the lower stratosphere and upper troposphere. This issue is also a major focus of the Subsonic Assessment component of AEAP.
Background: Assessment Models
The recent Atmospheric Effects of Stratospheric Aircraft (AESA) Models and Measurements Report [Prather and Remsberg, 1993] stated that:
significant uncertainties remain in the transport in zonally-averaged models, such that advancements in our understanding of chemical mechanisms may not necessarily improve many of the model/measurement comparisons in this report."
Key outputs from 2-D models are inconsistent between different models, and often inconsistent with data. Ozone distributions and calculated lifetimes for idealized long-lived tracers with tropospheric sources and pressure dependent sinks varied significantly among the models [Prather and Remsberg, 1993]. Considerable variability in estimates of atmospheric transport rates are found among these models. For example, Jackman et al. [1991] used three different transport estimates to show that the adequate simulation of a particular trace gas (i.e., ozone) does not necessarily imply that all trace gases are adequately simulated (i.e., C-14, aircraft NOx). Kawa et al. (in Prather and Remsberg, [1993]) compared tracer-tracer relationships from constituents in 2-D models with aircraft data from AAOE, AASE I, AASE II, and SPADE. They found that models differ substantially in the compactness of the relationships, but existing data could not resolve the differences; poleward-downward circulations tended to be too weak; and difficulties in simulating NOy, O3, and NOy/O3 ratios as a function of latitude indicated serious problems in lower stratospheric transport.
STRAT will supply a wealth of new, more complete constraints on such models from tracer-tracer relationships (e.g., CO2-N2O), high-altitude measurements, near-tropopause data, etc.
Framework for the Experimental Design:
1.Conceptual paradigms, observations, and model simulations of tracers
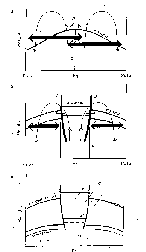
The experimental strategy for STRAT may be visualized by contrasting the idealized hypotheses describing global stratospheric tracer transport: the "global diffuser" and the "tropical pipe" (after Plumb and Ko [1992] and Plumb [1995], respectively). Figure 1a illustrates the global diffuser model, with advection by the residual circulation (upwelling in the tropics and downwelling at high latitudes) modified by quasi-isentropic mixing due to breaking planetary-scale waves in the mid- and high-latitude surf zone during winter [Holton, 1986; Mahlman et al., 1986; Plumb and Ko, 1992]. In this paradigm, air is mixed between the stratospheric extratropics (i.e., subtropics and middle latitudes) and the core of the tropical upwelling zone, giving rise to globally uniform isopleths (contours of constant mixing ratios). The slopes of these isopleths are determined by the relative strengths of the vertical circulation and the isentropic mixing. Consequently, tracer-tracer relationships are globally uniform for all long-lived species, including those with transient boundary conditions such as CO2 and SF6. Isopleths rise higher than isentropic surfaces in the tropics, and descend slightly lower than isentropic surfaces in mid- to high latitudes. Observed tracer-tracer relationships are remarkably uniform, indicating possible application of this paradigm. As an example, the diffuser model implies that Northern Hemisphere, mid-latitude HSCT emissions will be transported relatively efficiently to tropical high altitudes and to the Southern Hemisphere.
The tropical pipe model (Figure 1b) is similar to the diffuser model, except the exchange of air from higher latitudes into the tropics is assumed to cease at a boundary that defines the stratospheric inner tropics. Inside that boundary, vertical motion dominates transport and air is detrained to middle latitudes. The tropical region is isolated from the middle latitudes, and trace gas mixing ratios would reflect a balance between vertical lifting of air and the local net chemical source terms. Observations of the transport of material in the stratosphere (C-14) following atmospheric nuclear tests and dispersal of aerosols from Mt. Pinatubo suggest that this tropical pipe model may be very useful [Johnston, 1989; Trepte et al., 1993], since cross-hemispheric transport was not particularly efficient over short time scales. This paradigm is similar to the global diffuser model, but differs in the details of tropical mixing rates. The diffuser model implies that Northern Hemisphere, mid-latitude HSCT emissions outside the inner tropical zone could neither be transported to the global source region for ozone (above 25 km in the tropics) nor into the Southern Hemisphere. Further, tracer-tracer relationships in the pipe model are not uniform as a function of latitude.
Figure 1.
Idealized models for global-scale transport of tracers. (a) Global diffuser model, with rapid exchange between middle latitudes and tropics due to quasi-isentropic mixing in the winter mid-latitude surf zone. (b) Tropical pipe model, with vertical advective transport in the tropics, entrainment of tropical air into middle latitudes, and quasi-isentropic mixing restricted to subtropical latitudes and higher. (c) Net global fluxes in the tropical pipe model, near the tropopause, asymptotically approach the global diffuser model. [Plumb, 1995]
It is essential for AESA and UARP to determine where the atmosphere falls between these two idealized extremes, or whether the atmosphere is some combination of the two that varies as a function of altitude. Since the QBO is expected to modify tropical-extratropical exchange [Trepte and Hitchman, 1992], observations which address this issue must cover at least one full cycle of the QBO. Furthermore, the degree of isolation of the tropics is probably variable as a function of season; hence, enough observations must be made to determine the seasonal variability of the tropical trace gases.
Both the pipe and diffuser models imply that the flux out of the stratosphere may be inferred from a global diffusive flux-gradient relationship, using vertical profiles (e.g., CO2-N2O [Boering et al., 1994; Wofsy et al., 1994]) observed near the tropopause at middle latitudes ("Z -> Z0" in Figure 1c). However, some multi-dimensional models suggest otherwise [Hall and Prather, 1995]; this is a key problem to be studied using existing platforms and instruments.
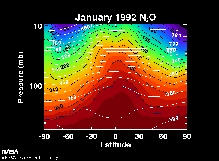
Global tracer distributions may be visualized using the results of 2-D and 3-D model simulations for N2O concentrations (Figures 2 and 3, respectively). In Figure 2, CO2 is included also, and is computed using lower boundary conditions from observations by the NOAA Climate Monitoring and Diagnostics Laboratory (CMDL) observations [T. Conway, private communication, 1994]. Stratospheric concentrations of N2O decrease with increasing altitude, reflecting the slow upward transport in the tropics and the downward transport in the polar regions. Figure 3 displays zonal mean N2O from the GSFC/SGCCP full chemistry model for January 1992. The N2O concentrations decrease with altitude as N2O is photolyzed by solar radiation, with a small additional loss by a reaction with O(1D). In Figure 2, concentrations of CO2 in the stratosphere also decrease with increasing altitude, again reflecting the slow upward transport in the tropics, and oscillate with seasonal and annual cycles near the tropopause. Isopleths for CO2 and N2O are parallel at extratropical latitudes, but there is a deviation in tropical latitudes that grows with altitude due to N2O photolysis aloft. Exchange with middle latitudes in the tropics is significant in this 2-D model, hence the small deviation from parallel isopleths. This 2-D model represents an atmosphere closer to the diffuser than to the pipe.
Figure 2.
Meridional cross section of CO2 and N2O in a 2-D model. Thick dotted lines are CO2 contours, thin solid lines are N2O contours. [H. R. Schneider, private communication, 1994]
Figure 3.
NASA/GSFC SGCCP 3-D chemical transport model simulation of January N2O using 1992 STRATAN wind fields.
A recent 3-D model [Hall and Prather, 1995] predicts a larger contrast for CO2-N2O relationships between the tropics and extratropics. There is a tracer-tracer slope discontinuity, giving this model many characteristics of the pipe concept. However, the tropical atmosphere is nonetheless significantly affected by exchange with higher latitudes [Hall and Prather, 1995]. This influence could be quantified by tracer measurements, as planned in STRAT, to determine the deviations from globally compact tracer-tracer relationships.
2. Previous mission tracer data: The foundation for STRAT
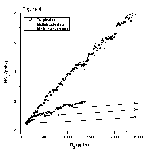
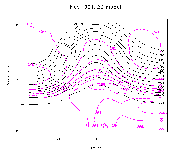
Observations indicate notably sharper demarcation of the inner tropical zone (where vertical advection dominates) than models. Observations in the Stratosphere-Troposphere Exchange Project (STEP) showed distinctly different NOy-O3 correlations in the tropics vs. the subtropics [Murphy et al., 1993], which cannot be satisfactorily explained by current models (Figure 4); measurements in SPADE and ASHOE/MAESA also showed dramatic tropical/mid-latitudecontrasts for many other tracers (e.g., CH4, N2O, CO, and CO2). Unfortunately, these observations are limited to the lowest altitudes of the tropical stratosphere, and we know little of tropical/extratropical exchange above ER-2 flight altitudes. Avallone and Prather [1995] modeled this NOy-O3 correlation with a simple 1-D model involving the production of O3 and NOy, and a simple lifting circulation in the tropics (Figure 5). Their comparison of the ER-2 observations to the model suggests that a simple lifting circulation underestimates the small values of the tropical NOy-O3 correlation, implying that mid-latitude material is being detrained into the tropics in the lower stratosphere. Results obtained from combining older balloon and aircraft data with ASHOE/MAESA measurements used tropical N2O and CFC-11 profiles to determine that more than 50% of the air in the tropics above 22 km originated in the middle latitudes [Minschwaner et al., 1995].
Figure 4.
Comparison of measurements and results from a 2-D model for NOy, O3, and NOy/O3 [Murphy et al., 1993]. Aircraft data are identified in the legend, ATMOS data from 19-21 km are represented by large diamonds.
Figure 5.
The co-evolution of O3 and NOy in the lower tropical stratosphere from the model (solid lines) is compared with observations from the tropics (circles) and the middle latitudes (squares). The tropical data are from STEP [Hipskind and Gaines, 1988]; and the mid-latitude data, from AASE -II [Gaines et al., 1993]. The measurements have been averaged over 10-ppb bins in O3. Solid circles represent the starting conditions for each of the model curves, with tick marks every 40 days of parcel evolution. [Avallone and Prather, 1995]
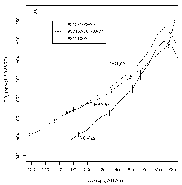
SPADE results also focused attention on the possible global significance of slow rates for vertical transport just above the tropopause [Wofsy et al., 1994]: vertical propagation of the CO2 seasonal cycle at extratropical latitudes is observed (relative to N2O) to be compressed into the lowest half-scale height above the tropopause (Figure 6) [Boering et al., 1994]. Unfortunately, present data sets are very sparse near the tropopause, especially at high latitudes where most troposphere-stratosphere exchange occurs; observations consist mainly of ascent and descent data, making it difficult to resolve atmospheric gradients or to assess how "compact" the tracer-tracer relationships may be.
Figure 6.
Binned and averaged observations for CO2 vs. N2O in the Northern Hemisphere stratosphere for November 1992, April-May 1993, and October 1993.
A principal focus of the measurements will be to study in detail the tracer distributions in the critical region defined by the tropopause ±3 km. We plan careful sampling over the Northern Hemisphere from the equator to 60 N, and flights specifically targeted on the tropopause region. Higher altitude data in the tropics, the focus of the high-altitude observations, are required to examine critically the effects of tropics/mid-latitude exchange.
Simultaneous tracer measurements with the widest possible range of lifetimes (or time scales for variation, for inert tracers like CO2) will be needed to provide resolution of the relevant time scales for transport. These should include relatively short-lived species (weeks-to-months: CO, C2H2, C2H6, C2Cl4), inert gases with significant seasonal variations and long-term trends (CO2), and species with chemical removal rates that vary rapidly with altitude, covering the maximum range of vertical scales (CH4, CFC-11/12/113, N2O).
In order to provide key data for validating data assimilation models of the lower stratosphere, a selected set of meteorological observations will be included in STRAT. Meteorological data are needed to define the tropopause altitude, a critical requirement for studies in the near-tropopause region. Moreover, the utility of earlier observations has been reduced because of the lack of a meteorological context. For example, the C-14 measurements were made vs. pressure altitude; the value of the data would have been greatly enhanced if potential temperature and potential vorticity were also recorded.
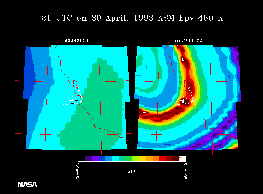
Precisely analyzed assimilation data fields offer a new tool for understanding observations of tracers. For example, Figure 7 displays an image of potential vorticity for one of the SPADE flights (April 30, 1993). The left panel shows the analyzed Ertel's potential vorticity (EPV), and the right panel shows the high-resolution EPV produced from a high-resolution set of back trajectories. The high-resolution EPV field reveals a streamer of polar EPV which had broken off the polar vortex 8-10 days prior to the ER-2 sampling, which corroborated the polar origin of the anomalous tracer concentrations in flights through the region. Similar transport occurs from the tropics, as streamers of tropical air are advected into the northern middle latitudes. The meteorological context provided by the analyzed fields and trajectory calculations for this aircraft data enabled the precise identification of this particular polar fragment. This capability is included as an important component of the mission.
Figure 7.
Comparison of Ertel's potential vorticity (EPV) on 30 April 1993 at 21 GMT on the 460 K isentropic surface. EPV from the STRATAN assimilation model is on the left panel, while EPV derived for the same time from back trajectories is on the right. The ER-2 flight track for this time is superimposed in white, with black points indicating crossings of 460 K. Note the streamer of polar (high) EPV intersecting the ER-2 path.
References
Avallone, L. M., and M. J. Prather, Photochemical evolution of ozone in the lower tropical stratosphere, submitted to J. Geophys. Res. , 1995.
Boering, K. A., B. C. Daube, Jr., S. C. Wofsy, M. Loewenstein, J. R. Podolske, and E. R. Keim, Tracer-tracer relationships and lower stratospheric dynamics: CO2 and N2O correlations during SPADE, Geophys. Res. Lett., 21, 2567-2570, 1994.
Gaines, S. E., P. Hathaway, and R. S. Hipskind, Editors., Airborne Arctic Stratospheric Expedition II CD-ROM, NASA/UARP-004, NASA Ames Research Center, 1993.
Hall, T. M., and M. J. Prather, Seasonal evolutions of N2O, O3, and CO2: Three-dimensional simulations of stratospheric correlations, J. Geophys. Res., in press, 1995.
Hipskind, R. S., and S. E. Gaines, Editors., Stratosphere-Troposphere Exchange Project CD-ROM, NASA/UARP-001, NASA Ames Research Center, 1988.
Holton, J. R., A dynamically-based transport parameterization for one-dimensional photochemical models of the stratosphere, J. Geophys. Res., 91 , 2681-2686, 1986.
Jackman, C. H., A. R. Douglass, S. Chandra, R. S. Stolarski, J. E. Rosenfield, J. A. Kaye, and E. Nash, Impact of interannual variability (1979-1986) of transport and temperature on ozone as computed using a two-dimensional photochemical model, J. Geophys. Res., 96 , 5073-5079, 1991.
Johnston, H., Evaluation of excess carbon 14 and strontium 90 data for suitability to test two-dimensional stratospheric models, J. Geophys. Res., 94, 18485-18493, 1989.
Mahlman, J. D., H. Levy II, and W. J. Moxim, Three-dimensional simulations of stratospheric N2O: Predictions for other trace constituents, J. Geophys. Res., 91 , 2687-2707, 1986.
Minschwaner, K., A. Dessler, J. W. Elkins, C. M. Volk, D. W. Fahey, M. Loewenstein, J. R. Podolske, A. Roche, K. R. Chan, The bulk properties of isentropic mixing into the tropics in the lower stratosphere, submitted to J. Geophys. Res. , 1995.
Murphy, D. M., D. W. Fahey, M. H. Proffitt, S. C. Liu, K. R. Chan, E. S. Eubank, S. R. Kawa, and K. K. Kelly, Reactive nitrogen and its correlation with ozone in the lower stratosphere and upper troposphere, J. Geophys. Res., 98 , 8751-8773, 1993.
National Research Council, Atmospheric Effects of Stratospheric Aircraft: An Evaluation of NASA's Interim Assessment, Panel on Atmospheric Effects of Stratospheric Aircraft, National Academy Press, Washington, DC, 1994.
Prather, M. J., and E. E. Remsberg, Editors, The Atmospheric Effects of Stratospheric Aircraft: Report of the 1992 Models and Measurements Workshop , NASA Ref. Pub. 1292, 1993.
Plumb, R. A., Vertical transport in the stratosphere: Global diffuser or tropical pipe? Paper presented at the Atmospheric Effects of Aviation Annual Meeting, Virginia Beach, VA, June 26-30, 1994.
Plumb, R. A., A "tropical pipe" model of stratospheric transport, J. Geophys. Res. , in press, 1995.
Plumb, R. A., and M. K. W. Ko, Interrelationships between mixing ratios of long-lived stratospheric constituents, J. Geophys. Res., 97 , 10145-10156, 1992.
Trepte, C. R., and M. H. Hitchman, The stratospheric tropical circulation deduced from aerosol satellite data, Nature, 355 , 626-628, 1992.
Trepte, C. R., R. E. Veiga, and M. P. McCormick, The poleward dispersal of Mt. Pinatubo aerosol, J. Geophys. Res., 98 , 18563-18573, 1993.
Wofsy, S. C., K. A. Boering, B. C. Daube, M. B. McElroy, M. Loewenstein, J. R. Podolske, G. S. Dutton, J. W. Elkins, and D. W. Fahey, Vertical transport rates in the stratosphere in 1993 from observations of CO2, N2O and CH4, Geophys. Res. Lett., 21, 2571-2574, 1994.

![Comparison of measurements and results from a 2-D model for NOy, O3, and NOy/O3 [Murphy
<em>et al.</em>, 1993].](/sites/default/files/styles/embedded/public/old_site/strat/images/Over_fig_4_small.gif?itok=Oi_4g4Vr)
